Chart
Thankful Insight enables you to chart any event that’s being tracked.
You can set up a custom Insight dashboard that displays the information most important to you.
Charts and their layouts can be customized in Edit Mode. To enter and leave Edit Mode, click the “Edit Mode” button at the top right of the page, or use the keyboard shortcut “e”.
You can edit charts, configuring the data you want to visualize and a title, if any. You can also add rows to add new charts below, and customize the number of charts per row as well as the height of each row.
EQL
Event Query Language (“EQL”) gives you the ability to query any events that have been tracked over time. Its syntax is designed to be deliberately similar to SQL.
All EQL statements take the form of:
SELECT val1, val2 AS "my value" FROM name WHERE val1 > 1 LIMIT 10
Examples
You can select all values for an event name using an asterisk like so:
SELECT * FROM name1
Or you can select the top 5 values by adding LIMIT 5 to the end, like this:
SELECT * FROM name1 LIMIT 5
There’s also full arithmetic support in the values, so you can do this to see the ratio of captured tickets out of the total received:
SELECT captured/received FROM _ticket
You can improve the label in the chart’s legend by using AS:
SELECT captured/received AS "Capture Rate" FROM _ticket
You can also pull data from multiple events in a single query using JOIN:
SELECT ato.complete / t.receive FROM _flow_track_order ato JOIN _ticket t
In most cases you’ll only want to specify one event in the FROM section.
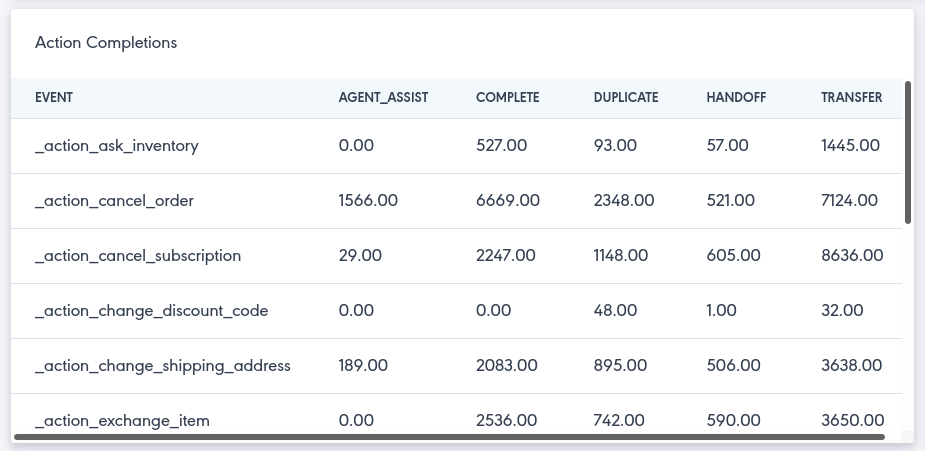
The one exception is when using a table, you’ll want to capture the same fields from many events to create many rows. In this example, we’ll pull the handoff, transfer, and complete numbers for various flows:
SELECT
    handoff,
    transfer,
    complete
FROM
    _flow_cancel_order,
    _flow_track_order,
    _flow_cancel_subscription
A WHERE clause can be used to only include data that matches a certain condition:
SELECT t.receive FROM _ticket t WHERE t.receive > 10
Charts
Events extracted using EQL can be displayed using a variety of chart types. Chart types include:
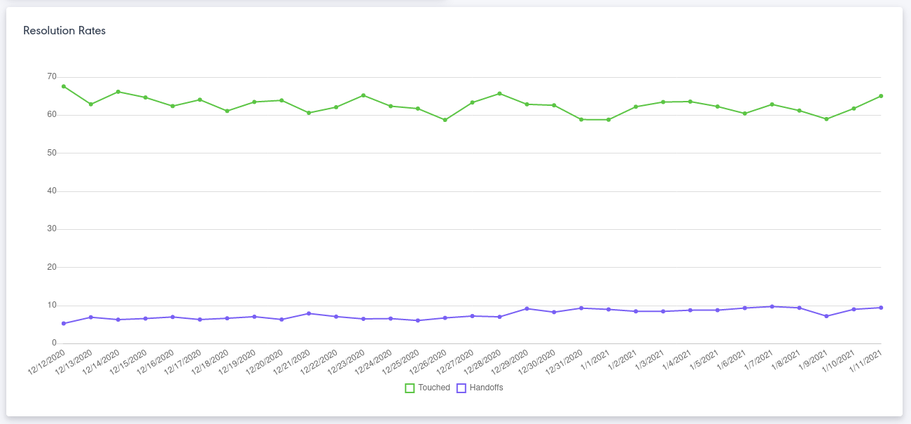
- Line: Show data over time.
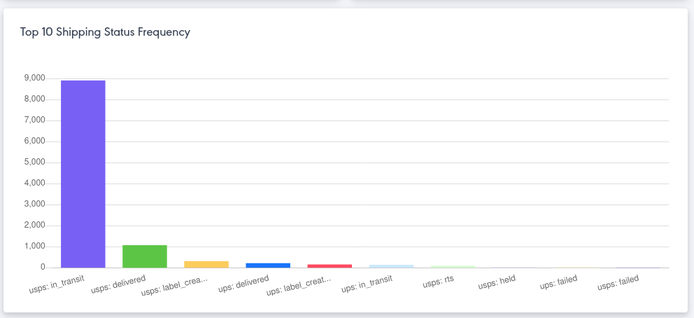
- Bar: Show totals for a given time period.
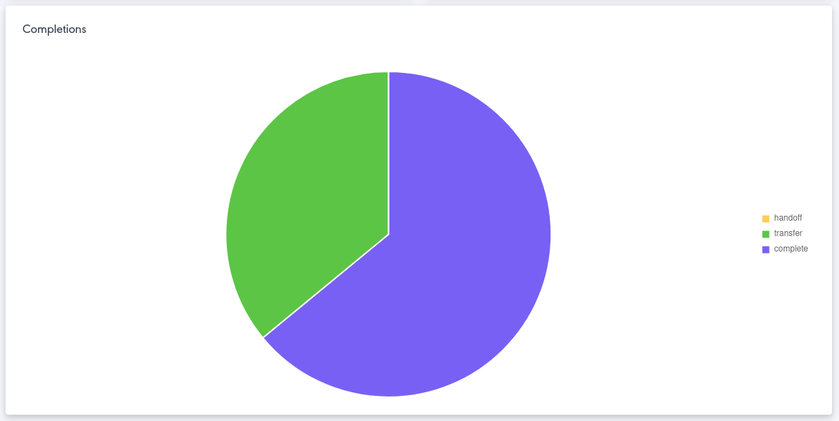
- Pie: Show event values as a percentage of the whole.
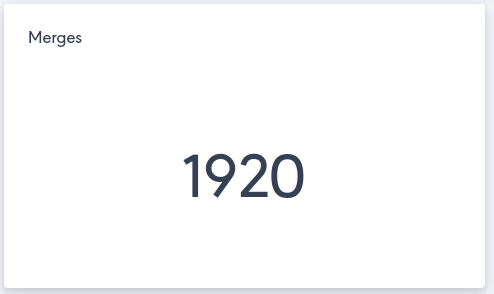
- Counter: Display a count of many times an event has occurred.
- Table: Show a table with rows and columns with data across events
Exporting Data
You can export reports to CSV by entering Edit Mode, clicking the appropriate “Edit Chart” button, then “Email CSV”. A secure link to download the CSV will be emailed to you when ready. It may take a few minutes to prepare the CSV for you.